I Gave Two Local Models the Same Take-Home. Neither Shipped.
A controlled experiment running qwen3-coder:30b and gpt-oss:20b unattended against an identical spec on a 12GB RTX 5070 — what they built, what broke, and why four of the five failures were mine.
The question
Can a model running entirely on a consumer GPU take a written spec and build a working full-stack application, unattended, with no human in the loop?
Not “can it autocomplete a function.” Can you hand it a take-home assignment, walk away, and come back to something that runs?
I ran the experiment properly: identical spec, identical starting commit, identical prompts, two models, sequential runs. Then I installed the results and tried to boot them.
The short answer is no. The longer answer is considerably more interesting than the short one, and the most useful finding had nothing to do with the models.
The rig
A single RTX 5070 with 12 GB of VRAM and 32 GB of system RAM. Ollama 0.34.0. No cloud, no API keys, nothing leaving the machine.
Twelve gigabytes used to mean “7B models, maybe a 14B if you squint.” That constraint has quietly stopped being true, and understanding why is a prerequisite for everything that follows.
Sparse models broke the VRAM rule
The old advice was that a model must fit entirely in VRAM. That is still true for dense models. It is no longer true for sparse Mixture-of-Experts models, and the difference is stark.
An MoE model has a large total parameter count but activates only a fraction per token. Ollama keeps attention layers and the KV cache on the GPU and offloads the expert weights to system RAM. Because only the active experts are needed for any given token, traffic across PCIe is a fraction of the model’s size.
Measured on this machine, 32K context:
| Model | Processor split | Decode | Prefill | Peak VRAM |
|---|---|---|---|---|
qwen3:8b | 100% GPU | 101.2 tok/s | 4767 tok/s | 9034 MiB |
gpt-oss:20b | 29%/71% CPU/GPU | 73.9 tok/s | 762 tok/s | 11619 MiB |
qwen3-coder:30b-a3b | 50%/50% CPU/GPU | 60.0 tok/s | 1245 tok/s | 11609 MiB |
A 30B model with half its weights in system RAM decodes at 60 tok/s. That is not a typo. Qwen3-Coder-30B-A3B activates roughly 3B parameters per token, so the offload penalty lands on a small slice of the weights. The same treatment applied to a 30B dense model would be unusable.
Context is a dial, not a cliff
The second measurement surprised me more. I swept context size expecting to find the point where VRAM runs out:
| num_ctx | Processor split | Decode | Peak VRAM |
|---|---|---|---|
| 8192 | 46%/54% CPU/GPU | 59.7 tok/s | 11585 MiB |
| 32768 | 50%/50% CPU/GPU | 56.7 tok/s | 11564 MiB |
| 65536 | 53%/47% CPU/GPU | 51.0 tok/s | 11586 MiB |
There is no cliff. Doubling context from 32K to 64K costs about 15% of decode speed and no additional VRAM — peak sits flat at ~11.58 GB across all three.
The reason is specific to offloaded MoE: the model does not fit anyway, so a larger KV cache simply pushes a few more expert layers into system RAM. It trades gradually against speed instead of hitting an allocation wall. On a dense model that currently fits in VRAM, raising context until it spills is a hard performance cliff. Here it is a slider.
That finding is what made the rest of the experiment viable. 64K of working memory on a 12 GB card is a different proposition from 32K.
One trap worth naming
Ollama defaults context to 4096 tokens. For chat that is fine. For an agent it is ruinous, and the failure is silent: the oldest tokens are dropped, so the model “forgets” instructions mid-task and starts looping. It looks like a stupid model. It is a truncated context.
Worse on Windows: Ollama typically runs as a tray app started at login, so it does not inherit environment variables you set in a shell afterwards. I hit this live — set the variables, restarted, and the server came up unconfigured anyway. They have to be set at User scope and the server genuinely restarted.
Verify with ollama ps and read the CONTEXT column. Do not assume.
The experiment
The spec was a deliberately underspecified take-home: build a full-stack app to explore ~5000 rows of job execution history from an internal compute platform. React frontend, a backend API, inspect individual runs, understand overall system behavior, filter, handle imperfect data reasonably.
Critically, it delegates every technical decision:
You may choose the backend framework, database/storage approach, visualization libraries, and overall UI design.
That sentence is the measuring instrument. More on that later, because it turned out to be the most contested design choice in the whole exercise.
The dataset was engineered to hurt
A flat random CSV produces a boring app and lets a model claim it “handled missing values” without ever meeting one. So the generator planted structure worth discovering and defects worth catching:
- A four-day incident window where failures spike 6×
- Cron-like recurring jobs, so time series are legible
- Two chronically-broken jobs that reward a per-job drill-down
- 5018 rows, 407 distinct job names, 90 days
And the defects, verified present in the final file:
| Defect | Count |
|---|---|
Missing finished_at | 60 |
| Negative durations | 35 |
| Unparseable timestamps | 30 |
Non-numeric memory ("16GB", "8g") | 23 |
Duplicate run_ids | 18 |
RUNNING rows that have a finish time | 25 |
| Untrimmed job names | 20 |
Null-ish sentinels (NULL, N/A, -) | 39 |
Plus eleven different spellings of success: SUCCESS, Succeeded, success,
OK, Complete, FAILED , failed.
The generator lived outside the app repo on purpose. A model that can see the generator can “handle” dirty data by regenerating it clean.
The harness
Aider, driven non-interactively. Each model got its own clean git clone of the
same baseline commit, then four unattended stages: decide → backend → frontend
→ docs. --yes-always, so nothing blocked on input. Every design decision was
the model’s; the prompts specify what to produce and never how.
Models ran sequentially, not in parallel — with OLLAMA_MAX_LOADED_MODELS=1, two
resident models do not fit in 12 GB, and running them concurrently would just
thrash the loader.
Aider rather than a fancier agent for two reasons that matter on constrained hardware: it uses a repo map plus explicit file adds rather than streaming whole files into context, and it does not use JSON tool calling at all — it parses edits out of plain text. Malformed tool-call JSON is the most common way local models fail as agents, and this sidesteps it.
Five failures, four of them mine
Before any results, the honest part. The first four runs produced nothing, and I spent most of this project debugging my own harness while blaming the models.
1. Argument splitting. PowerShell’s Start-Process -ArgumentList joins
arguments with spaces without quoting. My multi-line prompt was split into
separate argv entries, and aider read each word as a filename. It created empty
files named and, the, and choices. Fixed by writing prompts to a file and
using --message-file.
2. The instruction that caused the thing it forbade. My prompt said “do not
add data/job_runs.csv to the chat — it is too large.” Aider auto-detects
filenames mentioned in a message and offers to add them. --yes-always accepted.
Context hit 426k tokens against a 262k limit, CUDA OOM’d on startup, the real
files were truncated out, and the model replied — reasonably — “please add
SPEC.md.” Naming the file is what loaded it. Fixed with an .aiderignore and
prompts that refer to the CSV obliquely.
3. Edit format mismatch. I configured aider for diff format, which expects
SEARCH/REPLACE blocks. qwen3-coder naturally emits whole-file format — a
filename followed by a fenced block. Aider parsed nothing. This one is genuinely
half the model’s behavior, but diff was also my wrong call: the project is
greenfield, nearly every operation creates a file, and there is nothing to diff
against.
4. My own sample file broke the edit parser. This is the good one.
To avoid loading the 792 KB CSV, I wrote a small SAMPLE.md excerpt — with
triple-backtick fenced code blocks, because that is how you write markdown. Aider
chooses its edit fence based on characters present in context files. My backticks
made it negotiate an exotic fence (five backticks — visible in the logs). The
model ignored that and used ```markdown. Aider could not match the
fence, and every edit was silently discarded.
Exit code 0. “Done” in the logs. Zero files on disk.
The model had been producing sensible output the entire time. My sample file was
throwing it away. Rewriting SAMPLE.md with indented blocks instead of fences
fixed it instantly: the next run produced twelve files.
5. The same bug, wearing a hat. The docs stage then failed for both models,
because a README naturally contains ```bash blocks, and nested inside
aider’s outer fence the inner fence reads as the closing one. Both models wrote
good READMEs that were silently dropped. Instructing them to wrap output in six
backticks fixed it.
The lesson generalizes past this specific tool: when running agents unattended, check file counts, not exit codes. Every one of those failures returned success.
What they actually built
With the harness finally correct, both models completed all four stages.
qwen3-coder:30b-a3b | gpt-oss:20b | |
|---|---|---|
| Wall clock | 23.6 min | 8.1 min |
| Files | 16 | 12 |
| Commits | 1 large | 3 well-scoped |
| Language | JavaScript | TypeScript |
| Backend | Express, in-memory parse | Express + SQLite |
| Build tool | Create React App | Vite |
| Layout | flat src/components/ | src/backend/ + src/frontend/ |
| Data probe | scripts/inspect-csv.js | scripts/inspect_csv.py |
On paper, gpt-oss:20b wins comfortably and does it three times faster. It chose
TypeScript, loaded the CSV into SQLite so filtering is SQL rather than hand-rolled
loops, separated the tiers properly, and committed in meaningful increments. Its
DECISIONS.md gives a reason per choice.
qwen3-coder chose plain JavaScript and Create React App — deprecated since
2023 and removed from React’s own documentation. Its DECISIONS.md also hedges:
“Chart.js or Recharts”. It never actually decided, and shipped neither.
Then I tried to run them.
Booting the results
This is where the paper evaluation inverts.
qwen3-coder: one repair
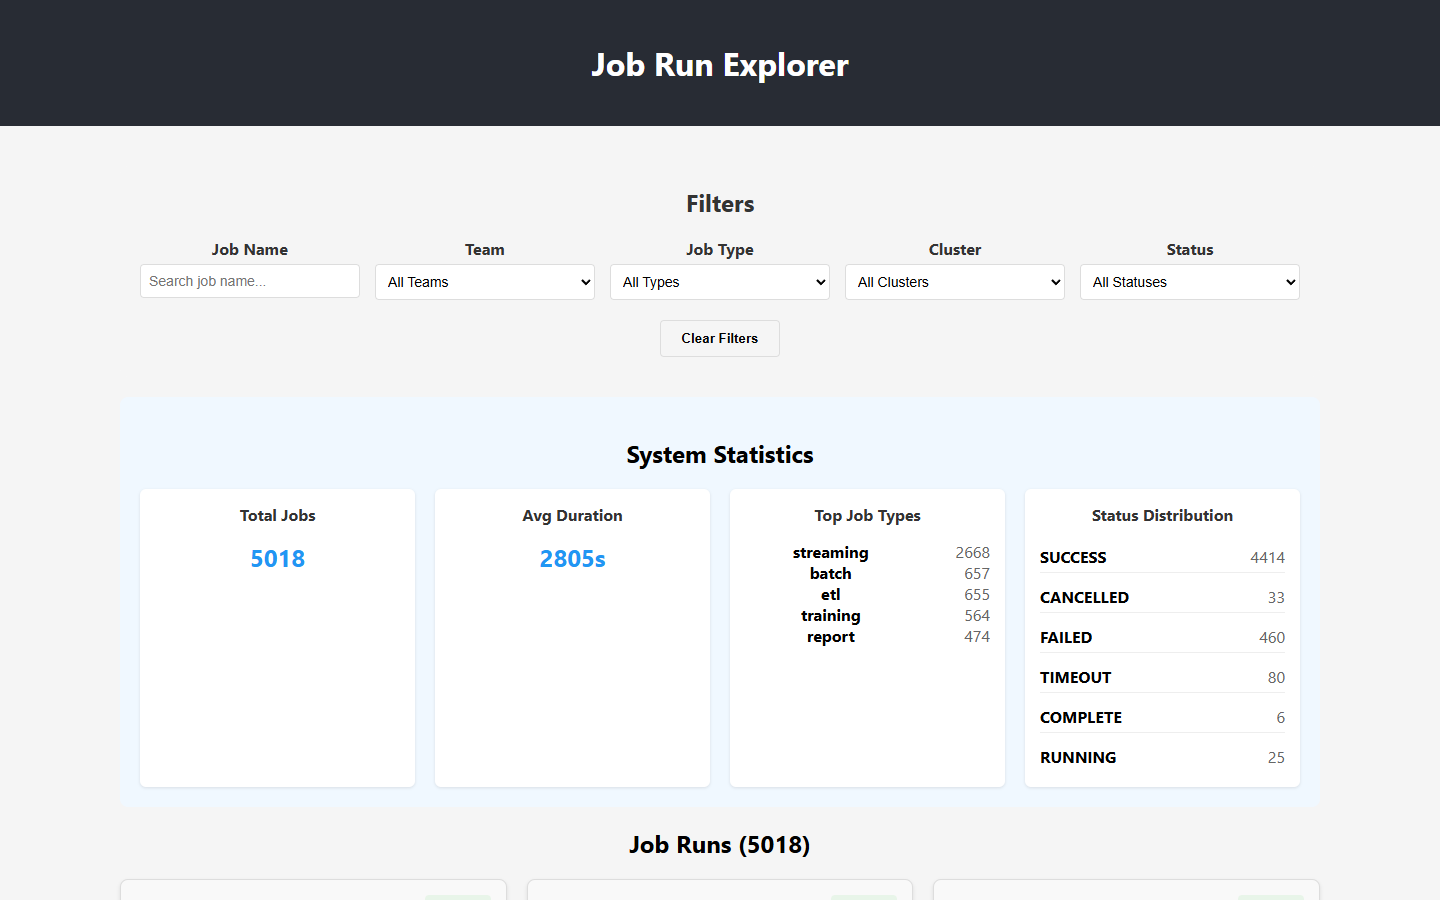
The backend started on the first try and parsed all 5018 rows. All four endpoints returned 200. The frontend compiled.
It needed exactly one fix: the frontend calls relative /api/job-runs, which
hits the dev server rather than the API, and package.json had no proxy field —
the standard CRA solution. One line.
That is a real, working internal tool. Filters across five dimensions, live summary statistics, a job list driven by actual data.
And it is not just rendering — it is correct. I drove it with a headless browser and checked the results against counts computed independently from the CSV:
| Interaction | App says | Ground truth | |
|---|---|---|---|
| Unfiltered | 5018 | 5018 | ✓ |
Status = FAILED | 460 | 460 | ✓ |
FAILED + nightly-user-rollup | 4 | 4 | ✓ |
The middle row is the interesting one. Reaching exactly 460 requires trimming
FAILED and failed before grouping — so the filter is exercising the
model’s own normalization logic and getting it right.
Filtering to FAILED, then narrowing by job name:
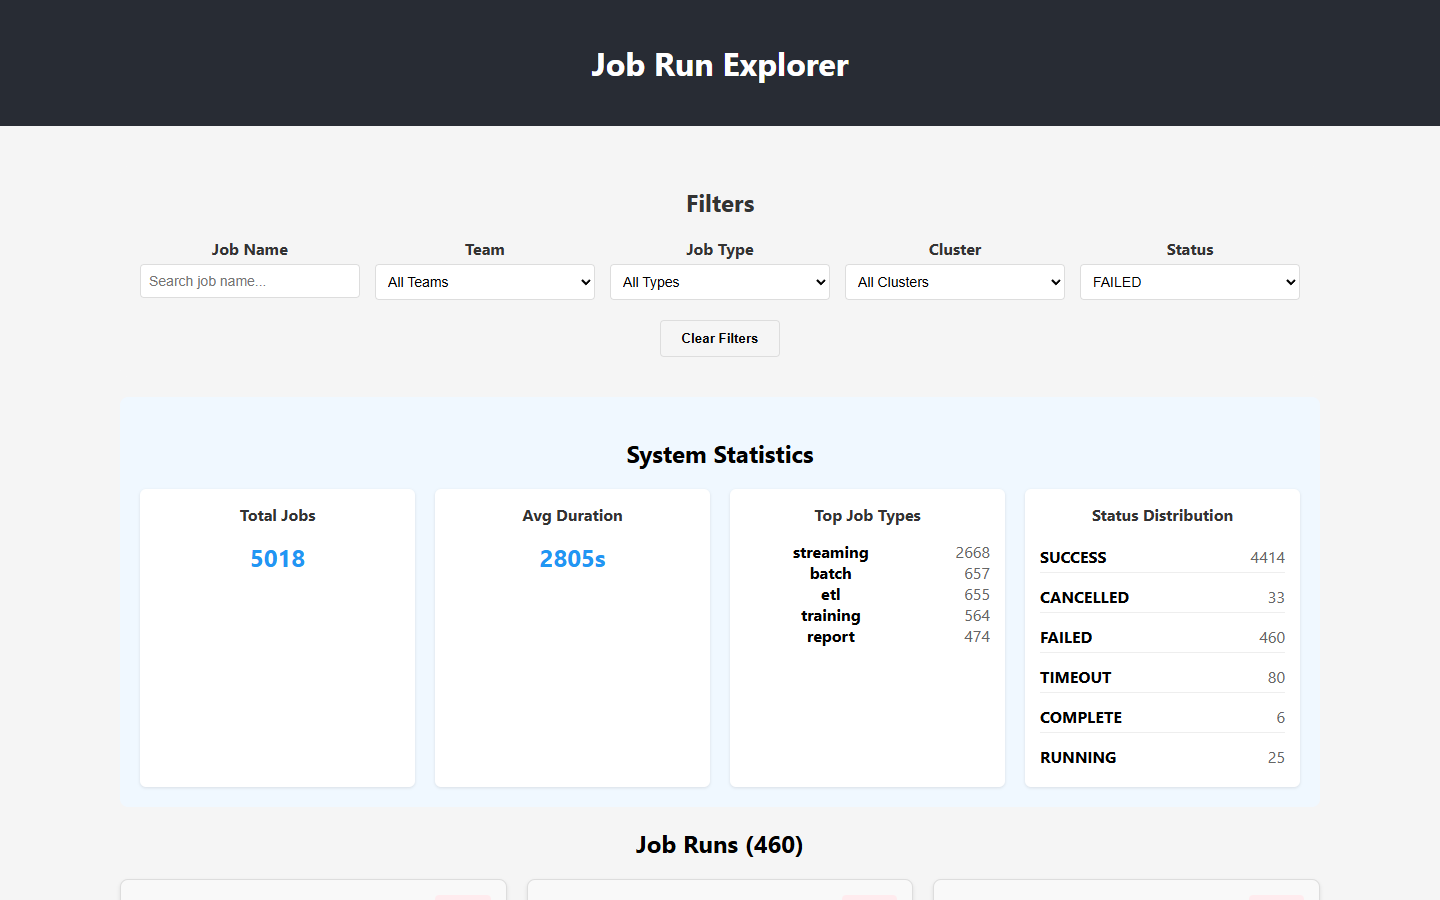
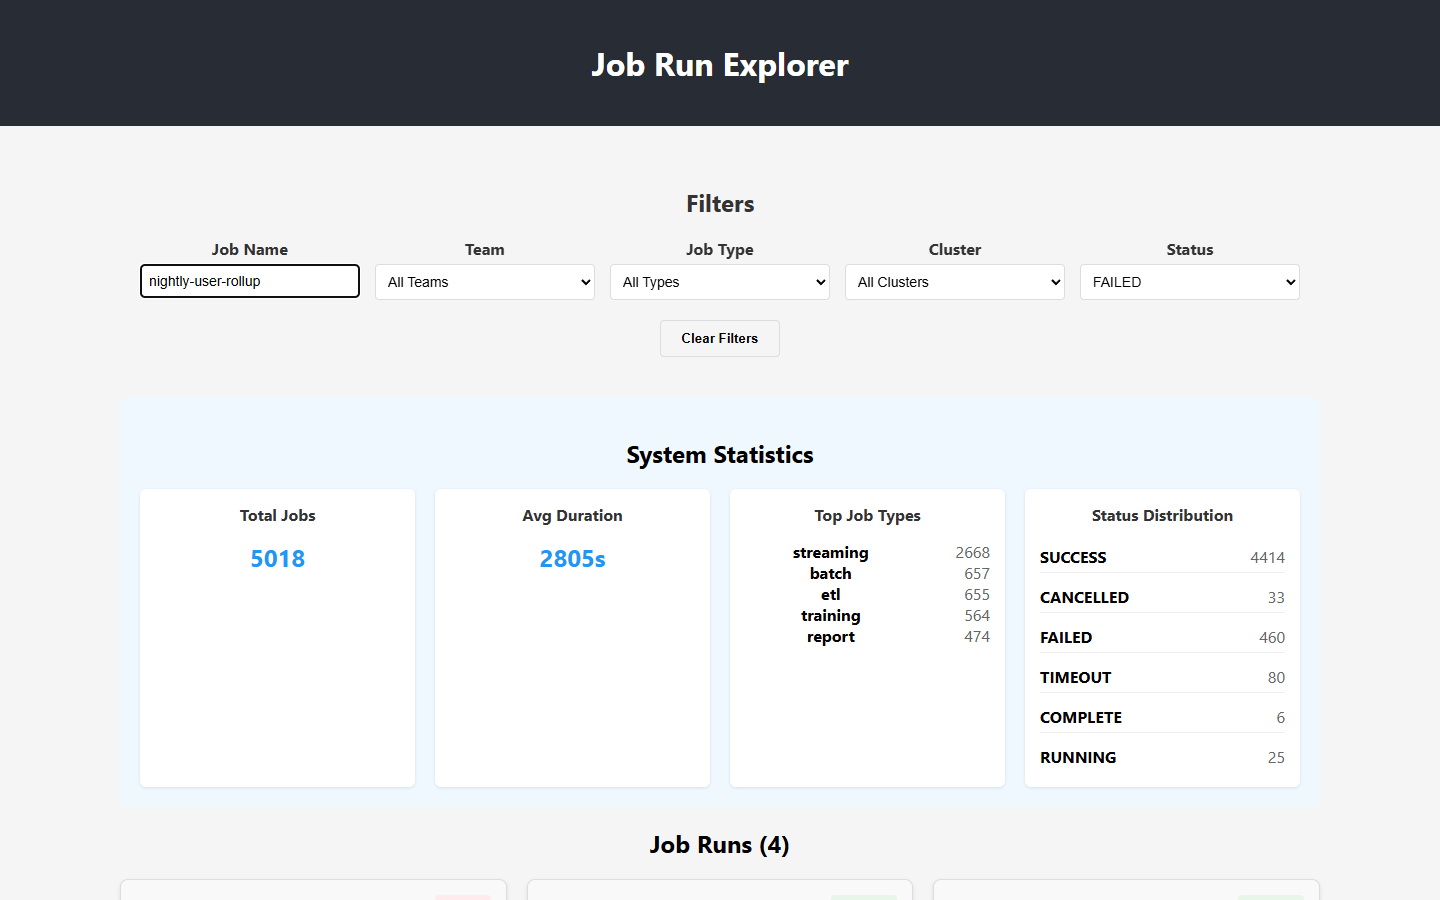
And the run list itself — status badges, surfaced error messages, resource columns. This is a plausible internal tool, not a toy:
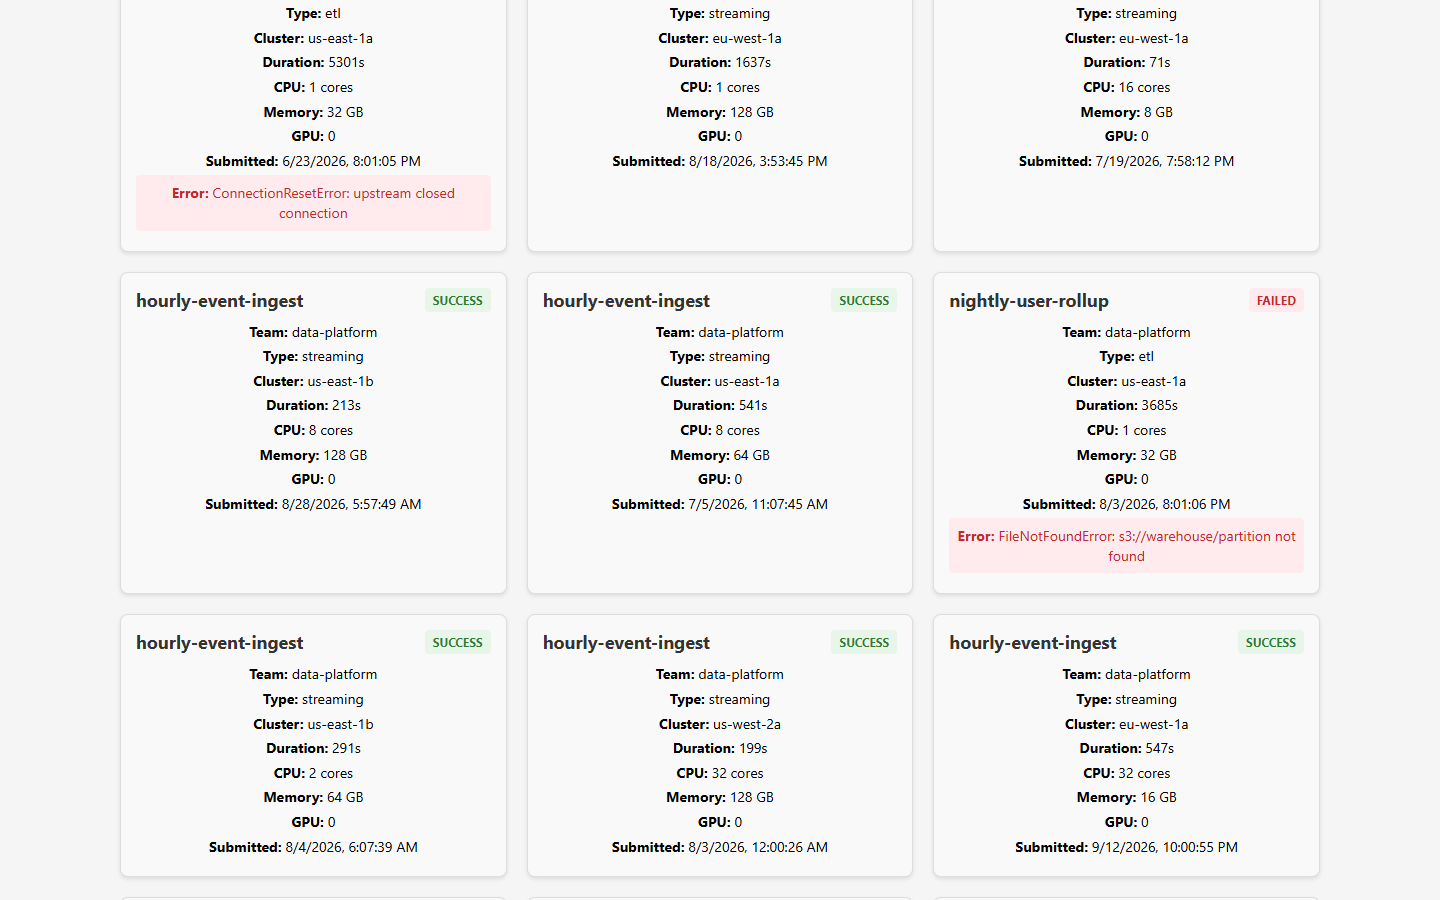
It is also quietly revealing. Look at Status Distribution: SUCCESS 4414
folds in success, Succeeded, and OK, and FAILED 460 correctly trims
FAILED and failed. The normalization genuinely worked — except COMPLETE: 6
leaked through as its own status. The data-cleaning gap is visible in the product.
Two more defects the screenshot cannot show. The rendered page is 502,636 pixels
tall — it renders all 5018 rows with no pagination or virtualization. And the
console throws Encountered two children with the same key, because it used
run_id as the React key and the dataset has 18 duplicates. The planted defect
surfaced as a real bug.
There are no charts, despite DECISIONS.md promising them.
gpt-oss: eleven repairs, still broken
The better-architected project did not run, and getting it close took eleven documented repairs:
- Five undeclared dependencies.
package.jsonlisted only frontend packages. The backend importsexpress,cors,csv-parse,sqlite, andsqlite3— none declared. No script existed to start the backend at all. - Vite project, CRA layout. It put
index.htmlinpublic/, where Vite does not look. Served 404 at the root. - Proxy pointed at the wrong port — 3000, which on this machine is Open WebUI.
- Proxy stripped the
/apiprefix its own routes are mounted under, so it would have failed even on the right port. - Wrong import shape.
import sqlite from 'sqlite'thensqlite.open(...). The package exportsopenas a named export, so this wasundefined. - Duplicate-key crash. The schema declares
run_idunique. The loader hit my 18 duplicates and died withSQLITE_CONSTRAINT. The spec asked it to handle imperfect data; it crashed on the imperfection. 7–11. Parameter binding, repeatedly. The SQL uses@namedplaceholders but passes objects with bare keys, so node-sqlite3 falls back to positional binding and throwsSQLITE_RANGE— in the INSERT, then in every query handler. Empty bind objects throw too. I converted it to positional binding.
After all eleven, the database builds and the aggregate endpoints work. The
primary /api/runs endpoint still returns 500.

Unstyled, and erroring — the list view reports a bare HTTP 500. The Dashboard
route fares no better:

There is a final irony. The backend exposes three aggregate endpoints —
/api/aggregate/status, /duration, /health. They work. They are the only
endpoints that work. The frontend never calls any of them. Both the list and
the Dashboard hit /api/runs. The three working endpoints are dead code, and the
one thing the UI depends on is the one thing that is broken.
Its README is truncated at 17 lines, ending at ## Installation with nothing
underneath — missing all four required deliverables.
Credit where it is due
gpt-oss did do one thing better. Its status normalization is cleaner: five
values, no COMPLETE leak, versus qwen3-coder’s six. The model that could not
boot understood the data better than the model that could.
Was the open spec a mistake?
The sharpest question this raised: if Create React App is indefensible in 2026, is the spec at fault for not forbidding it?
I do not think so, and the experiment contains its own control. gpt-oss:20b
chose Vite + TypeScript from the identical spec. Same file, same prompts, same
baseline commit. If the instructions were underspecified, both models would have
defaulted to something dated. One did not. That isolates the CRA choice as a
property of the model rather than a gap in the prompt.
Pinning the stack would convert the experiment from “does this model exercise judgment” into “can it type out a Vite config.” Mandating Vite would have hidden the symptom while leaving the disease: a model reaching for CRA has stale priors, and stale priors show up in a hundred choices you will not think to specify.
The honest caveat is that this depends on what you are measuring. To compare implementation quality head-to-head — whose filtering is better, whose cleaning is more careful — pinning the stack removes a confound. Judgment and craft are different axes, and an open spec tests the first at the cost of muddying the second.
The interesting follow-up is not specifying the framework. It is adding one line —
“choose a stack you would defend in a 2026 code review” — and seeing whether
qwen3-coder self-corrects. That distinguishes not knowing CRA is dead from
merely defaulting. Very different failure modes.
What this actually tells you
Architecture quality and working code are uncorrelated. The model that made
better decisions produced worse software. If you evaluate local models by reading
their output, you will rank them backwards. gpt-oss writes like a senior
engineer and ships like one who never ran the code.
Both models write code they never execute. Every failure in the gpt-oss run —
missing dependencies, wrong import shape, broken parameter binding — would have
surfaced on the first npm start. Neither model has a feedback loop. The single
highest-leverage change to this harness would be a stage that runs the thing and
feeds errors back.
Planted defects earn their keep. The 18 duplicate run_ids produced a React
key warning in one app and a hard crash in the other. Both DECISIONS.md files
claimed to handle imperfect data. Neither handled duplicates. Without the planted
defect, both claims would have gone unchallenged.
Check artifacts, not exit codes. Five distinct failure modes, every one reporting success.
Unattended means unattended. --yes-always auto-confirms bad ideas as
readily as good ones. It created twenty junk files without a word of protest.
That is the trade: it is why each run is an isolated clone, and why nothing here
should be trusted without review.
So can a local model build your app?
Not unattended. Not yet. Not on 12 GB.
But the failure is more interesting than a flat no. Both models produced coherent architecture, correctly identified subtle data-quality problems, and wrote plausible code. One produced a genuinely usable internal tool after a one-line fix — which is not nothing, and would have taken me longer than 23 minutes to write by hand.
The gap is not reasoning. It is the absence of a feedback loop. These models write like engineers who never run anything, and that is a harness problem as much as a model problem.
Which is fitting, given that four of my five failures were harness problems too.
Hardware: RTX 5070 12 GB, 32 GB RAM, Ollama 0.34.0, aider 0.86.2. Both output repositories and full transcripts were retained. Neither model modified the source CSV — verified.
The formal experimental record — hypotheses, method, threats to validity, and reproduction steps — is Lab Z Working Paper #3.